
Soundscape Dashboard
What the Pulau Pari lagoon sounds like right now: an ecosystem health score, who is making the noise (sea, boats or marine life), the latest hydrophone recordings and underwater camera images.
Guardians of the Pulau Pari Lagoon
Pulau Pari is a small coral island in the Seribu Islands archipelago, located just 45 km north of Jakarta Bay. Its shallow-water lagoon hosts one of Indonesia's most ecologically significant marine ecosystems — yet it sits in a critically vulnerable position between a megacity and the open Java Sea.
The lagoon supports thriving seagrass meadows, coral reef gardens, and mangrove fringes that act as nurseries for hundreds of marine species. These ecosystems are also the livelihood of local fishing communities who have depended on these waters for generations.
As shipping traffic, urban runoff, and climate pressures intensify, the underwater soundscape of the lagoon reveals critical early-warning signals invisible to the human eye. PAM-Z listens continuously — 24 hours a day — so scientists can detect ecosystem stress before it becomes irreversible.
Why does sound matter?
A healthy reef sounds like a crackling fire — rich with snapping shrimp, fish calls, and biological activity. A degraded one falls silent. By analyzing the acoustic fingerprint of the lagoon, PAM-Z can measure biodiversity, detect anthropogenic disturbance, and track ecosystem recovery — all without disturbing the marine life.
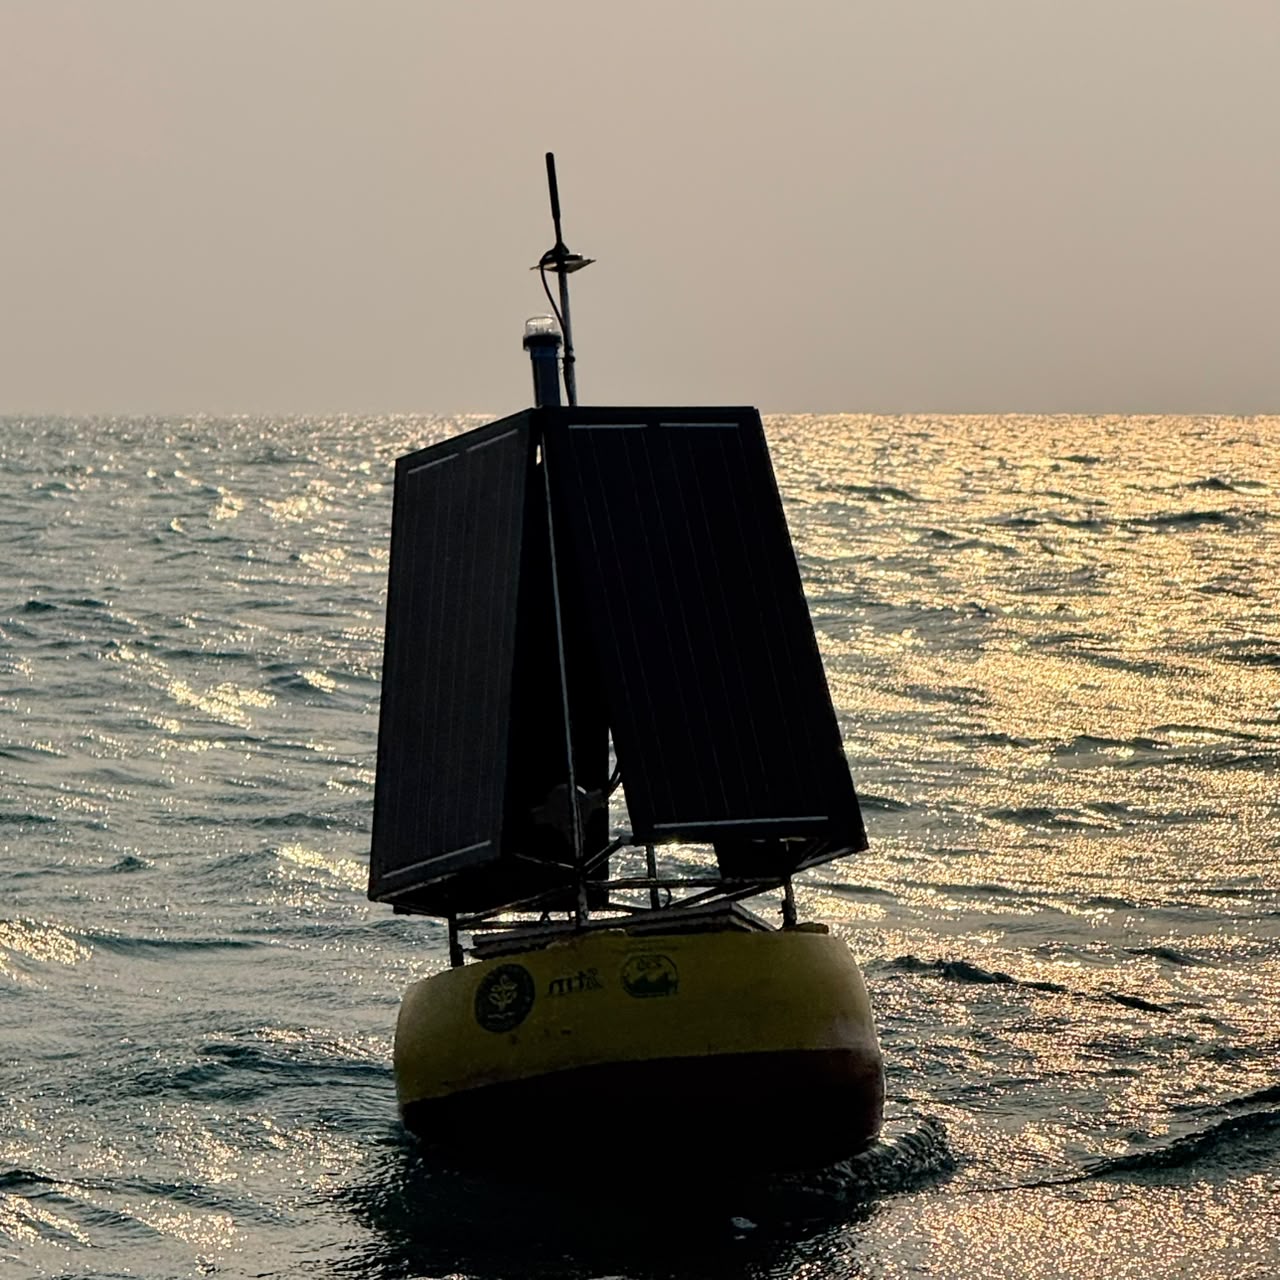
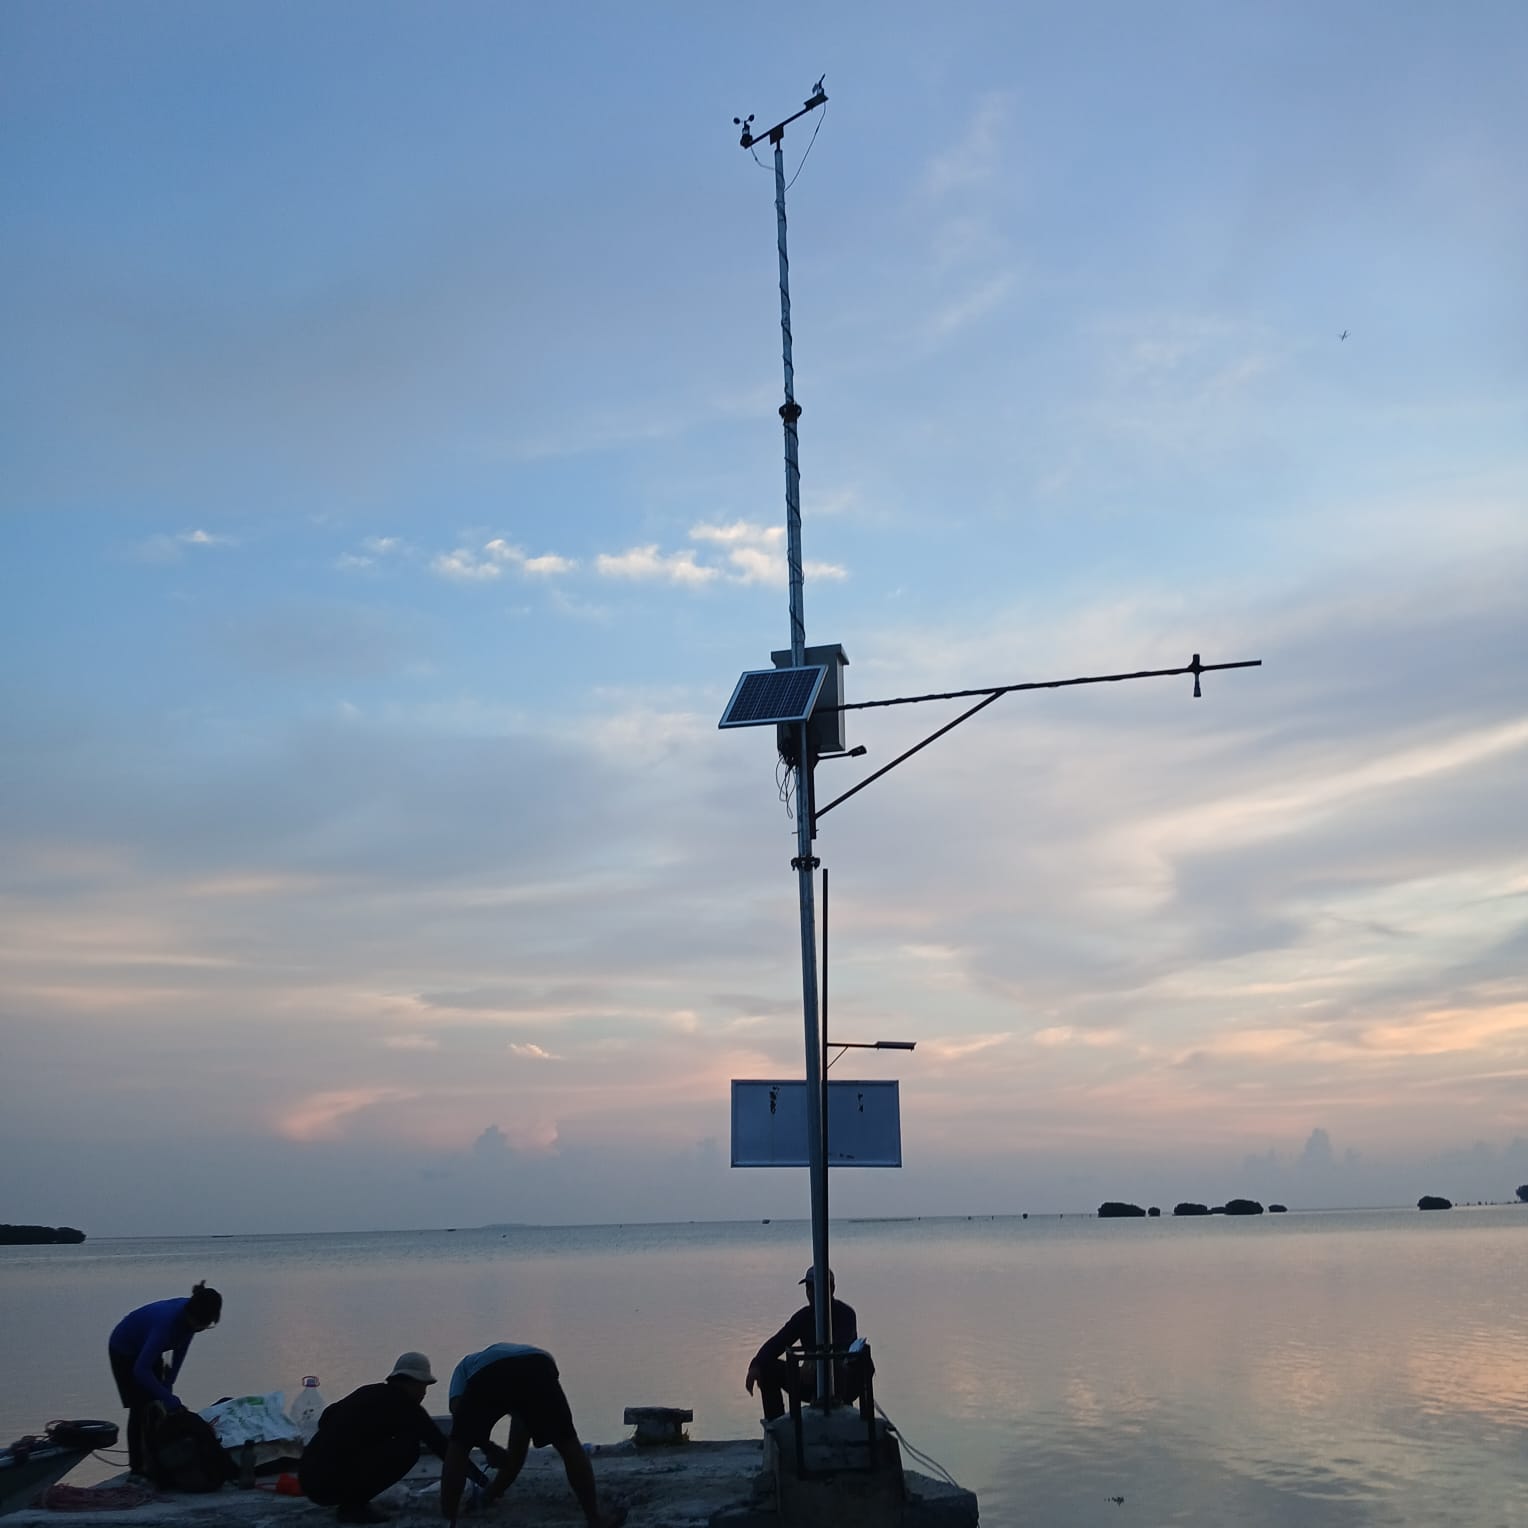
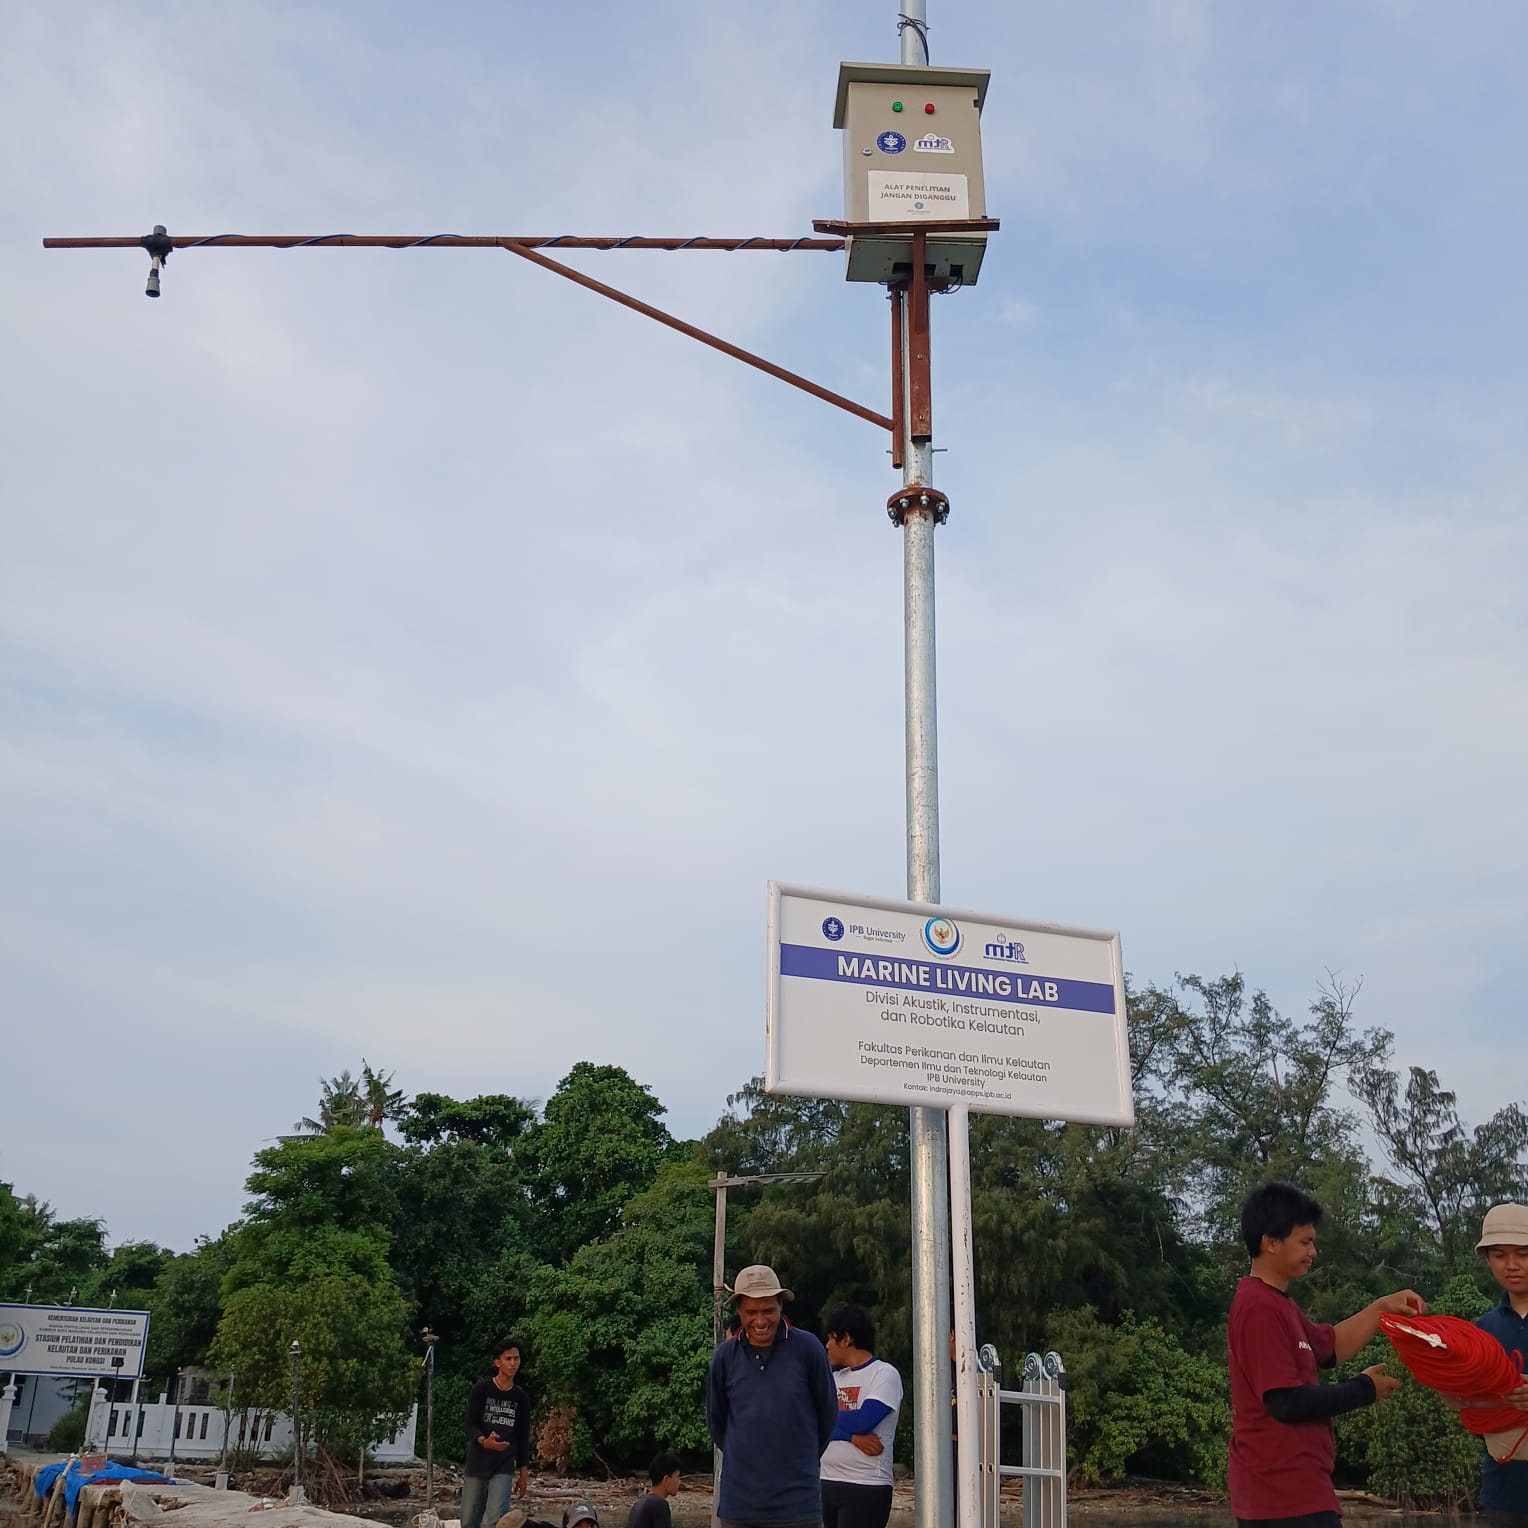
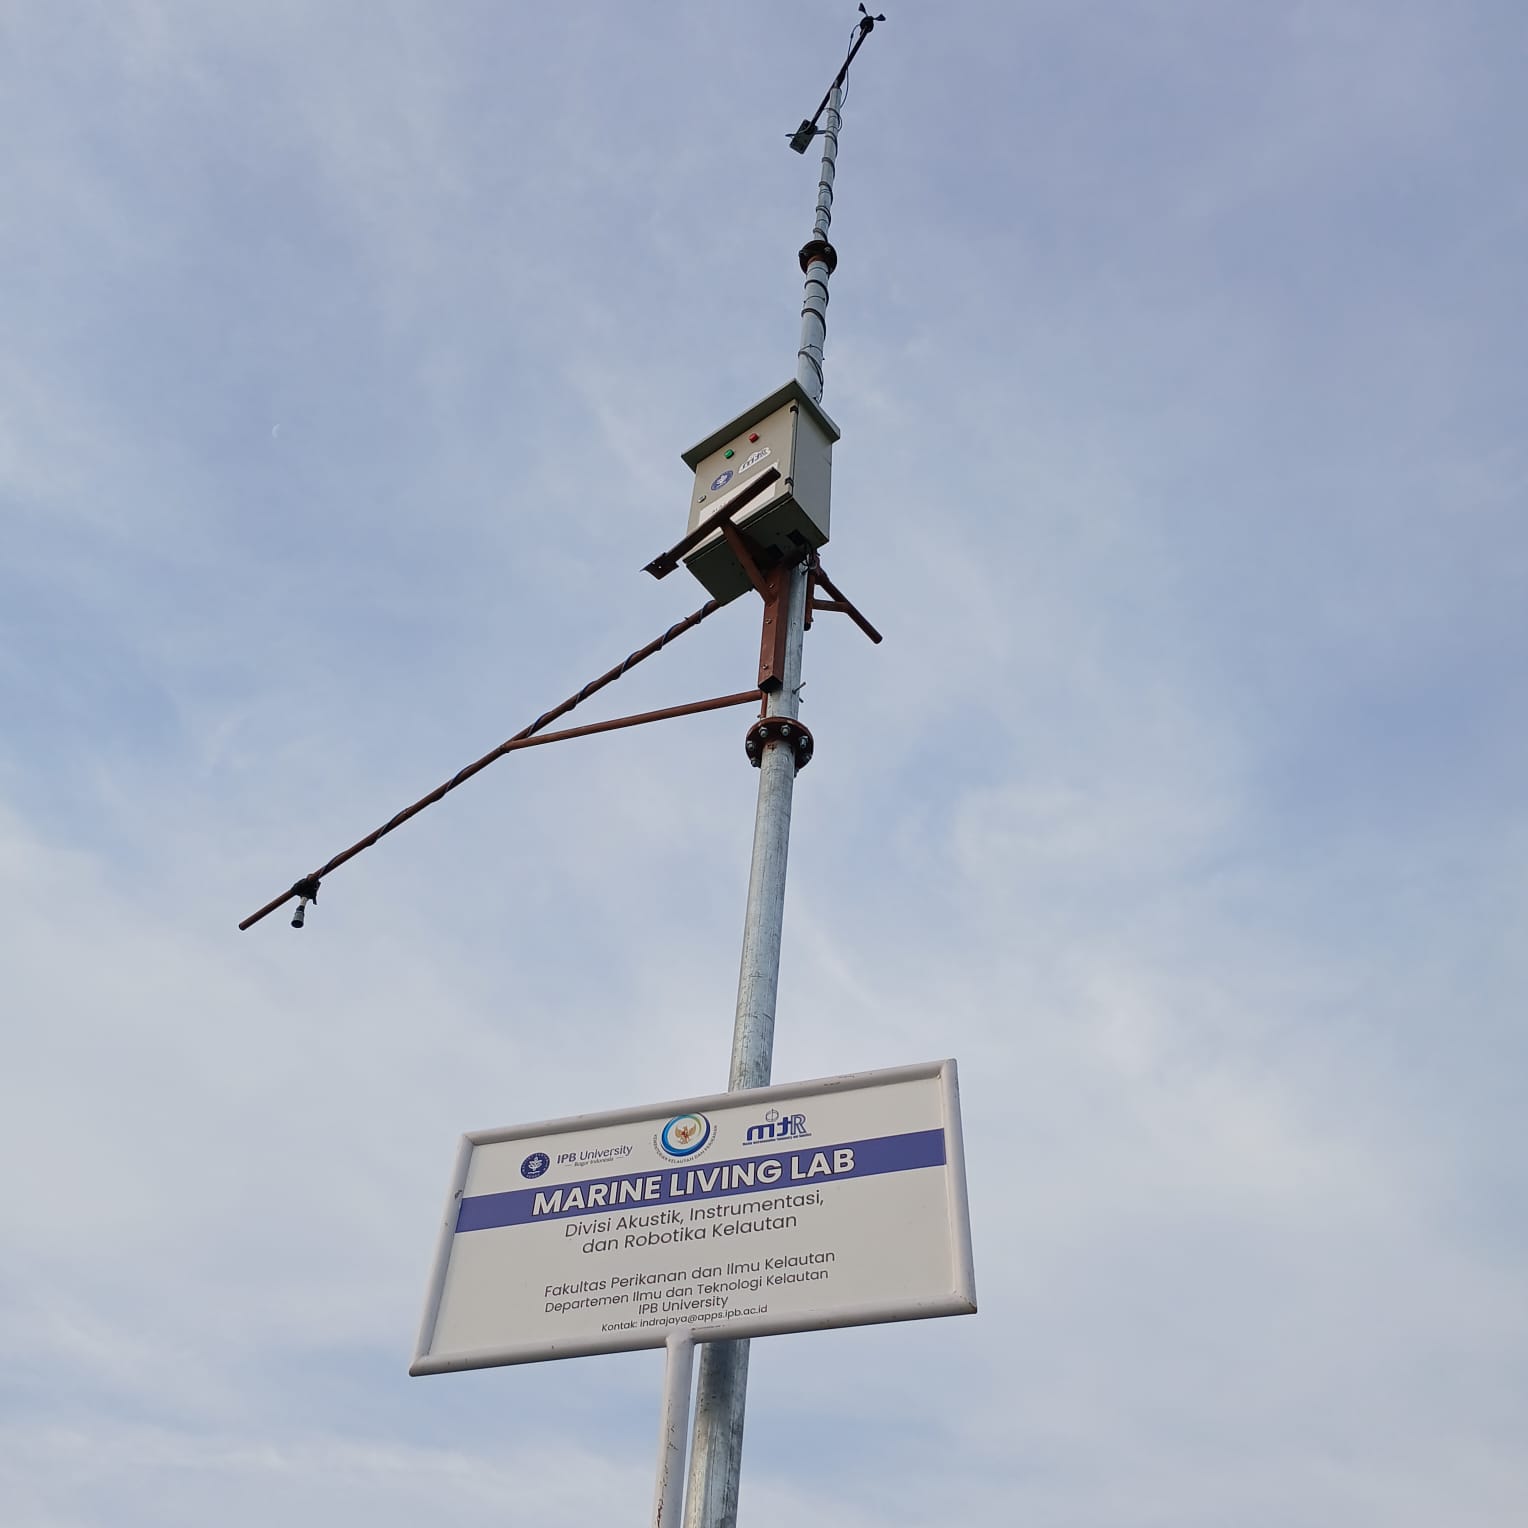
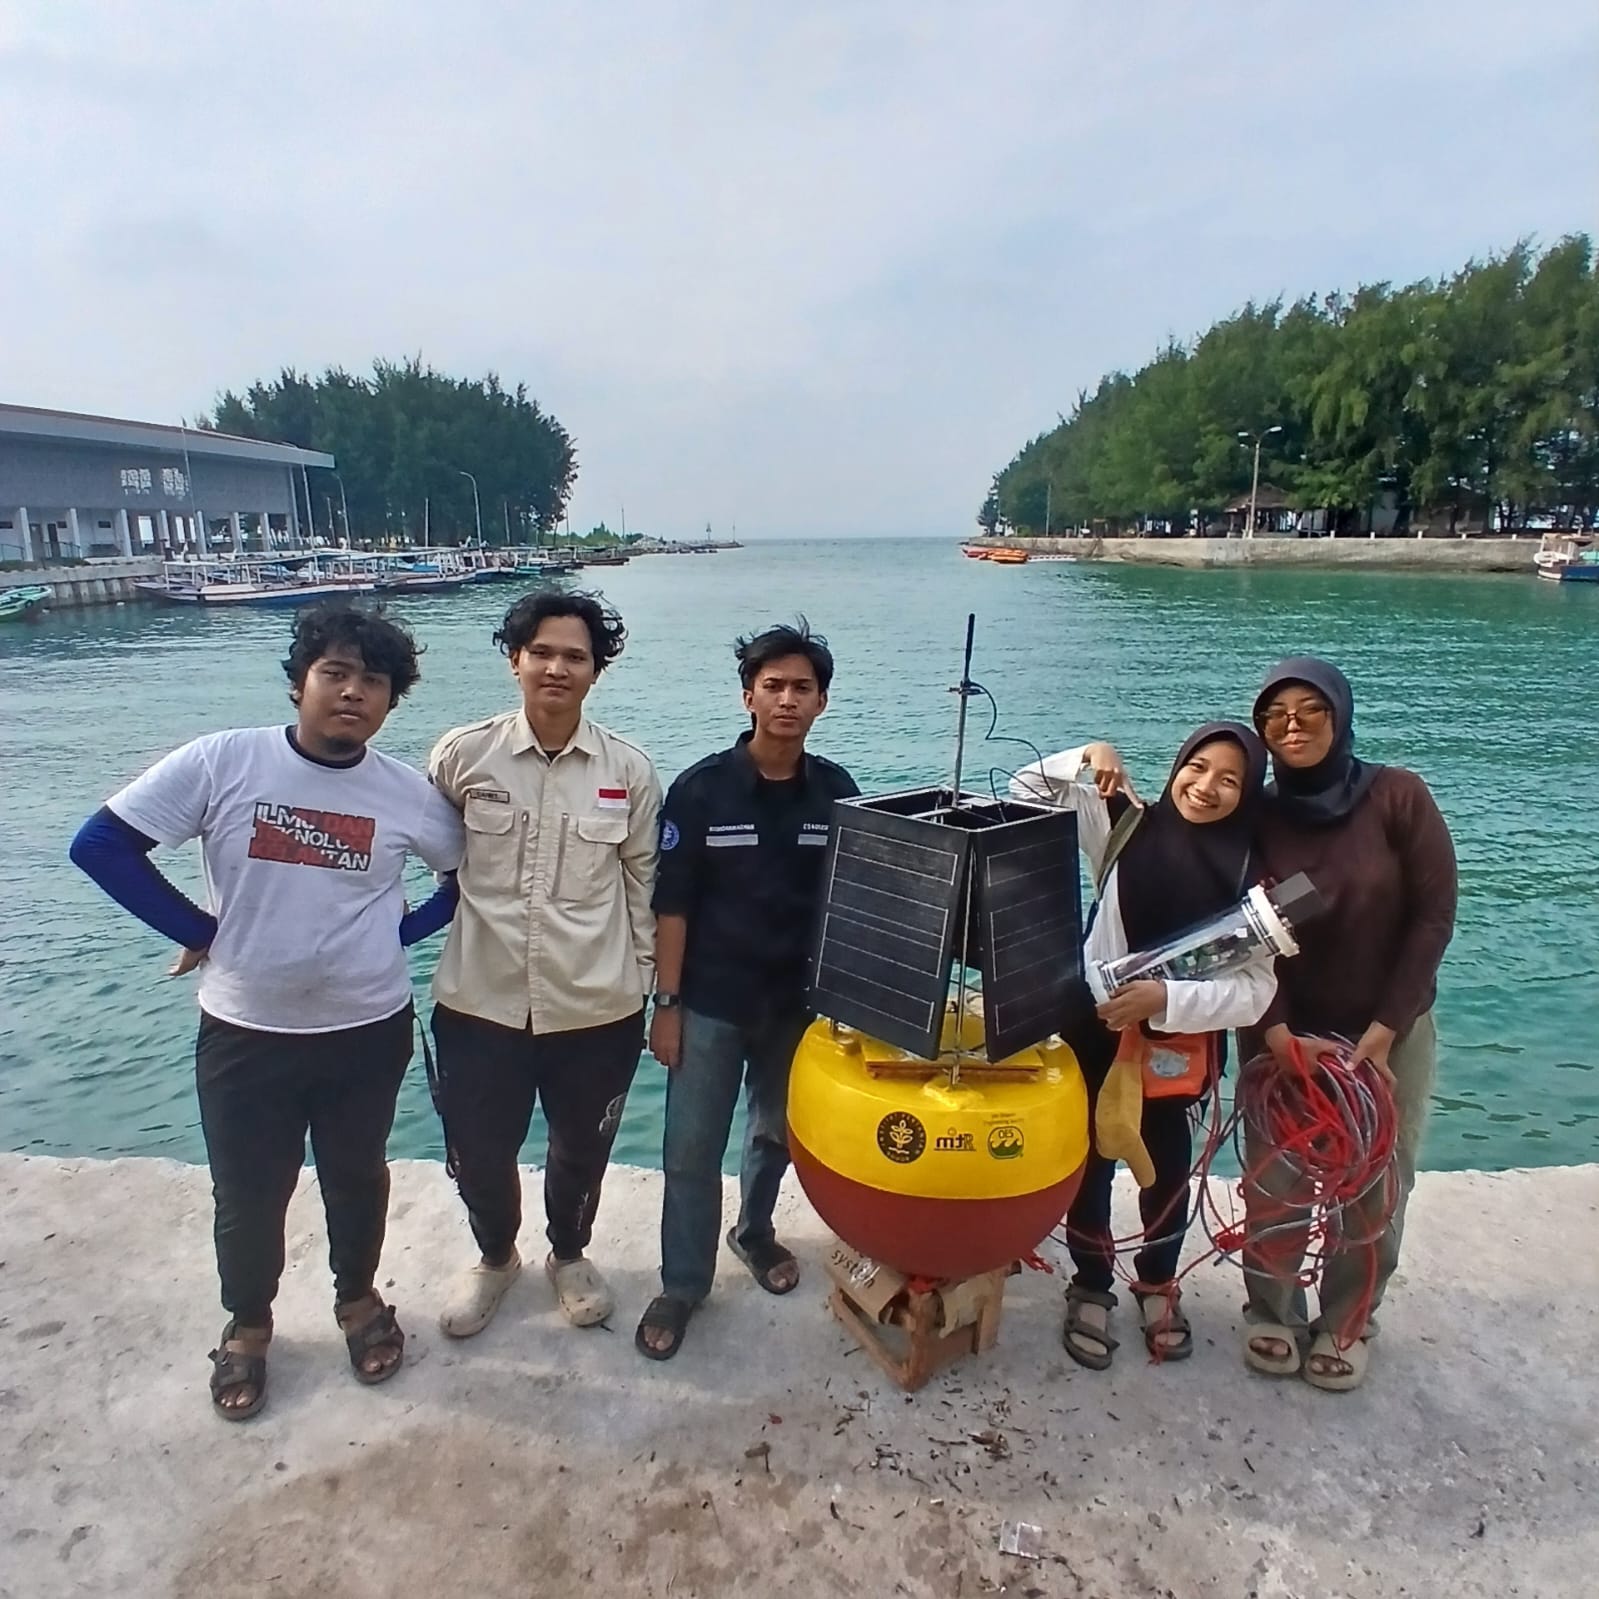
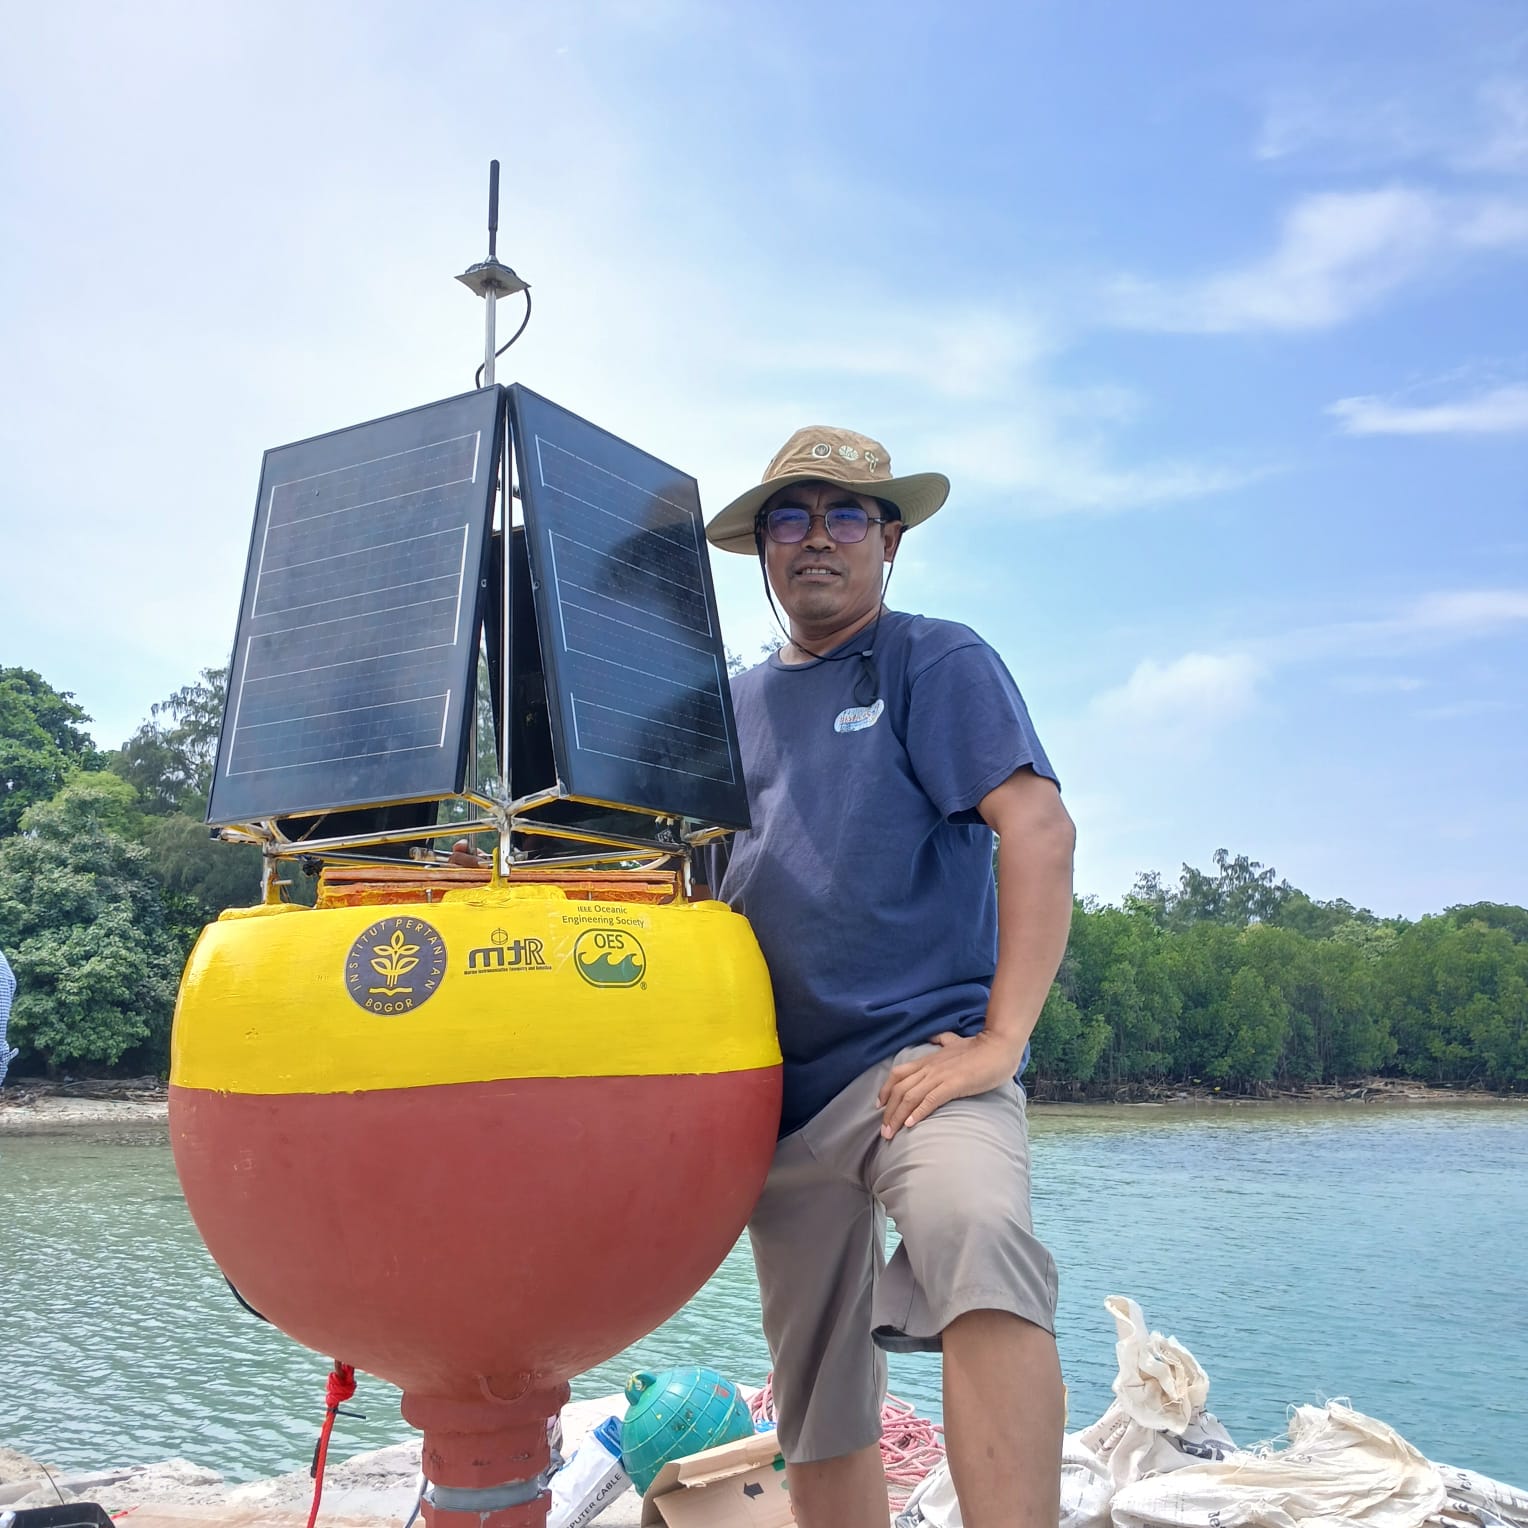
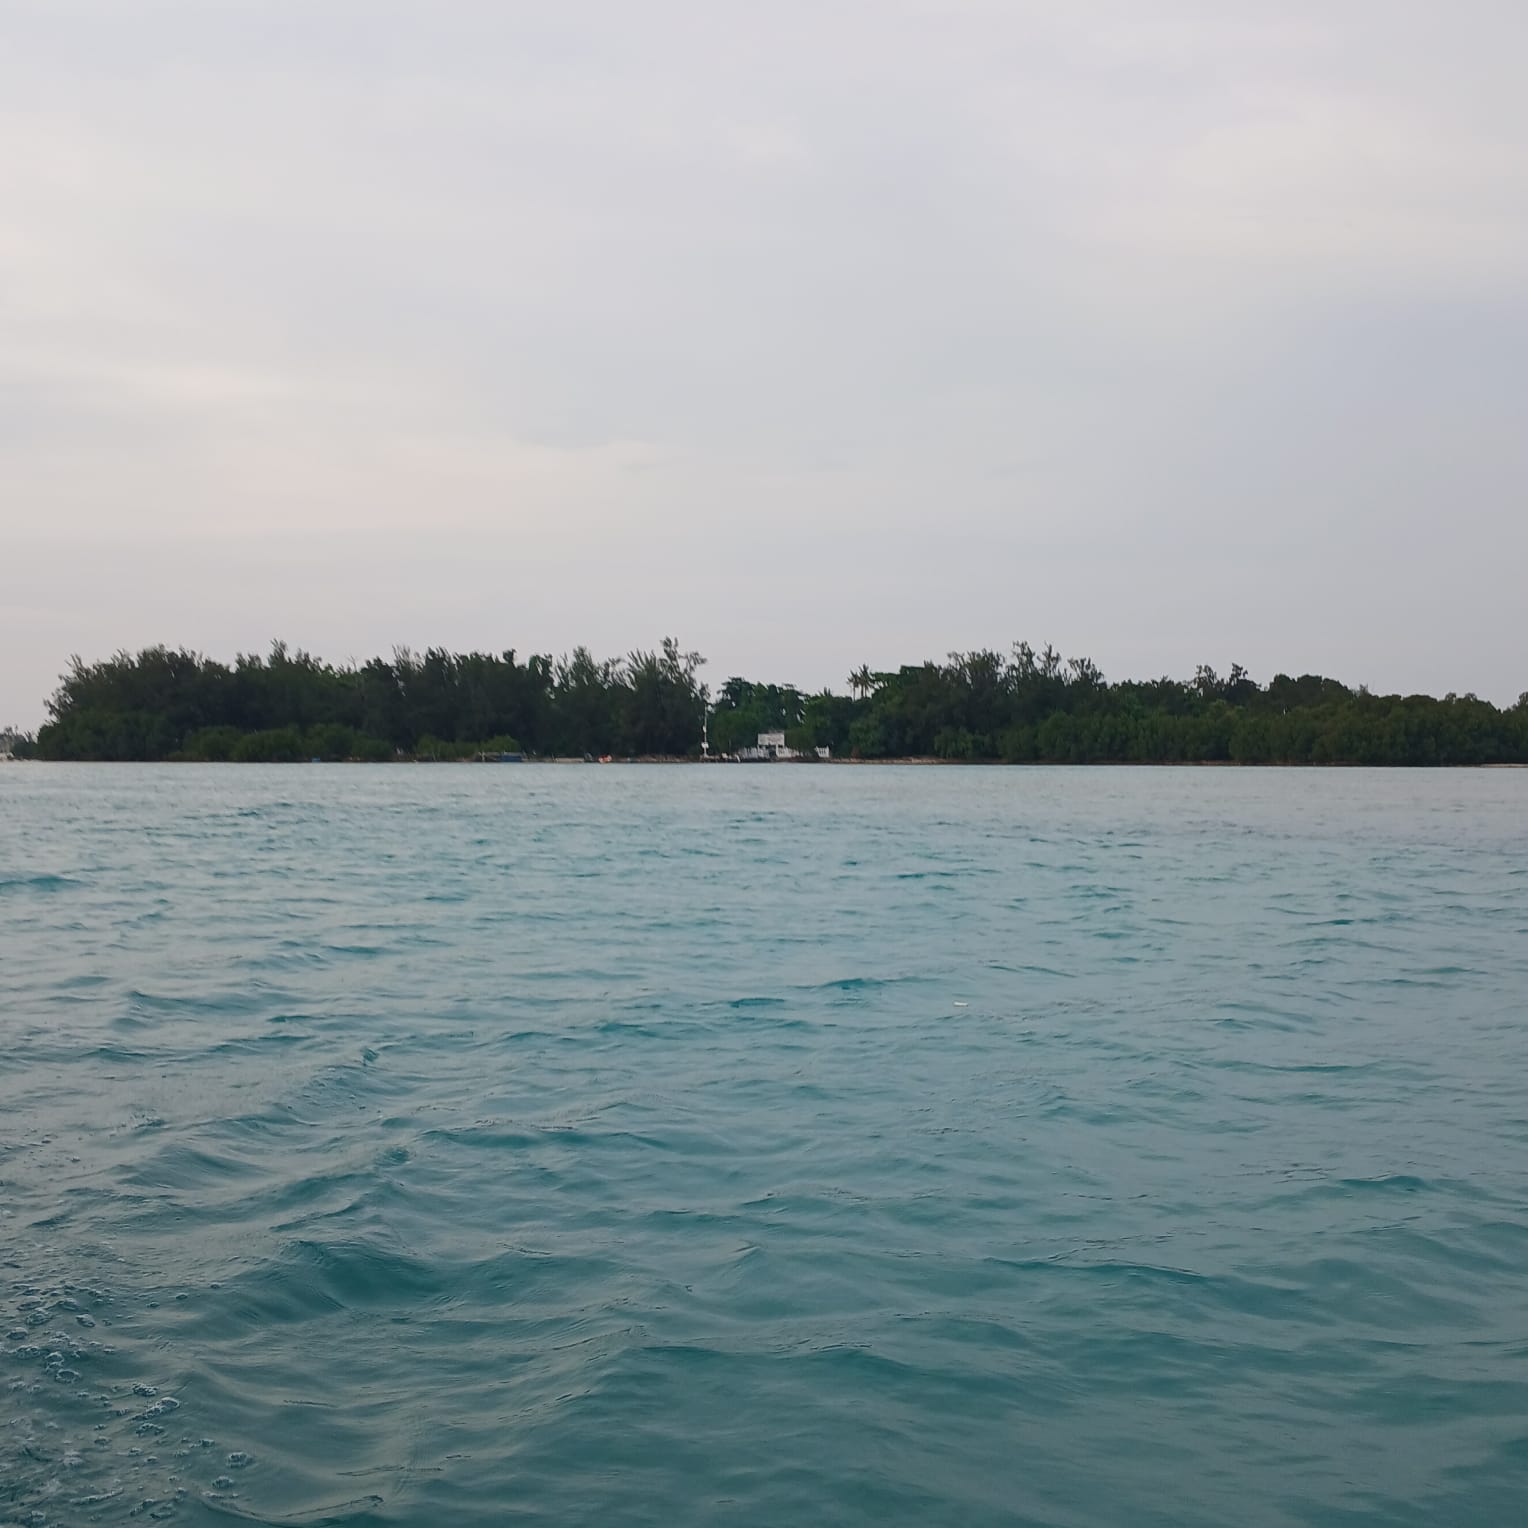
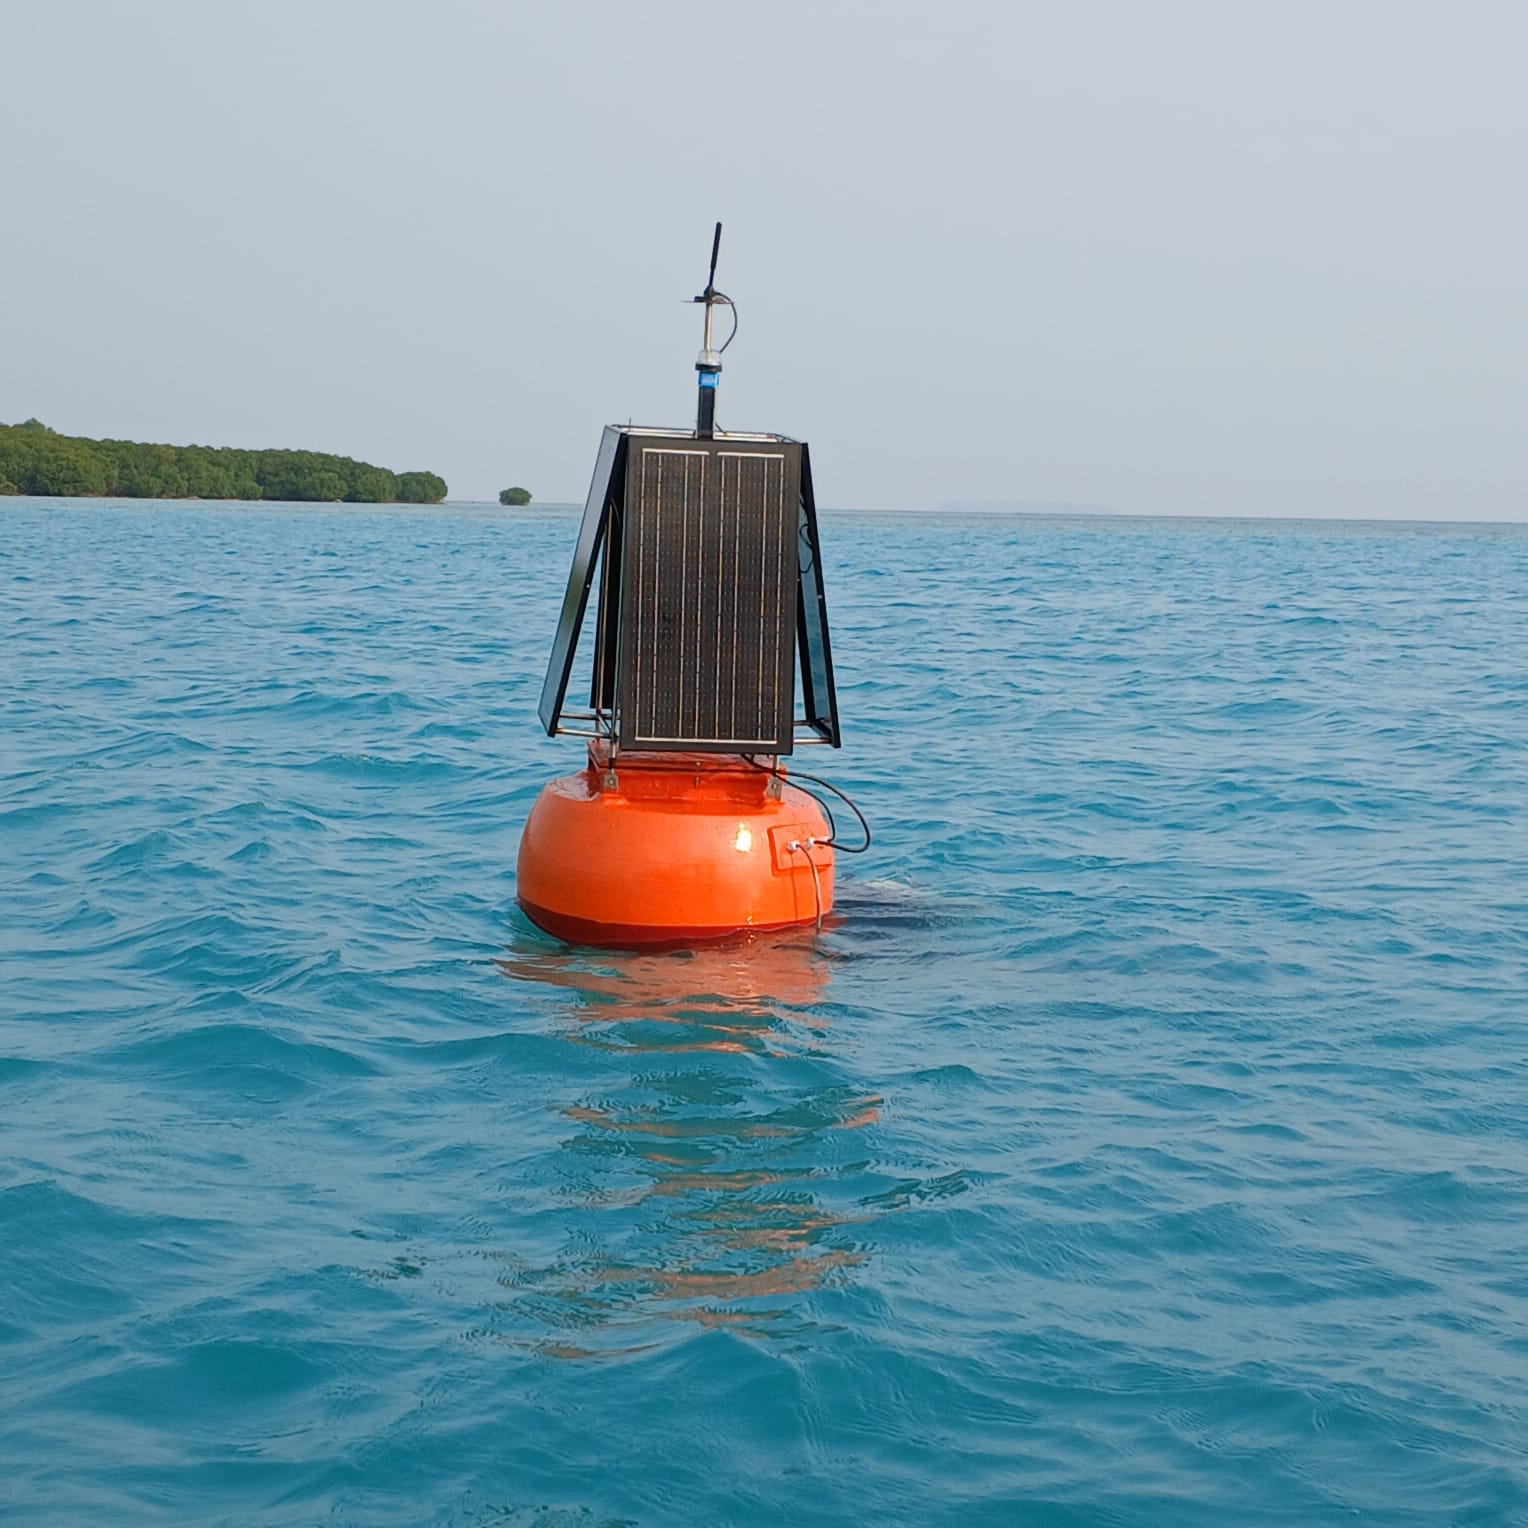
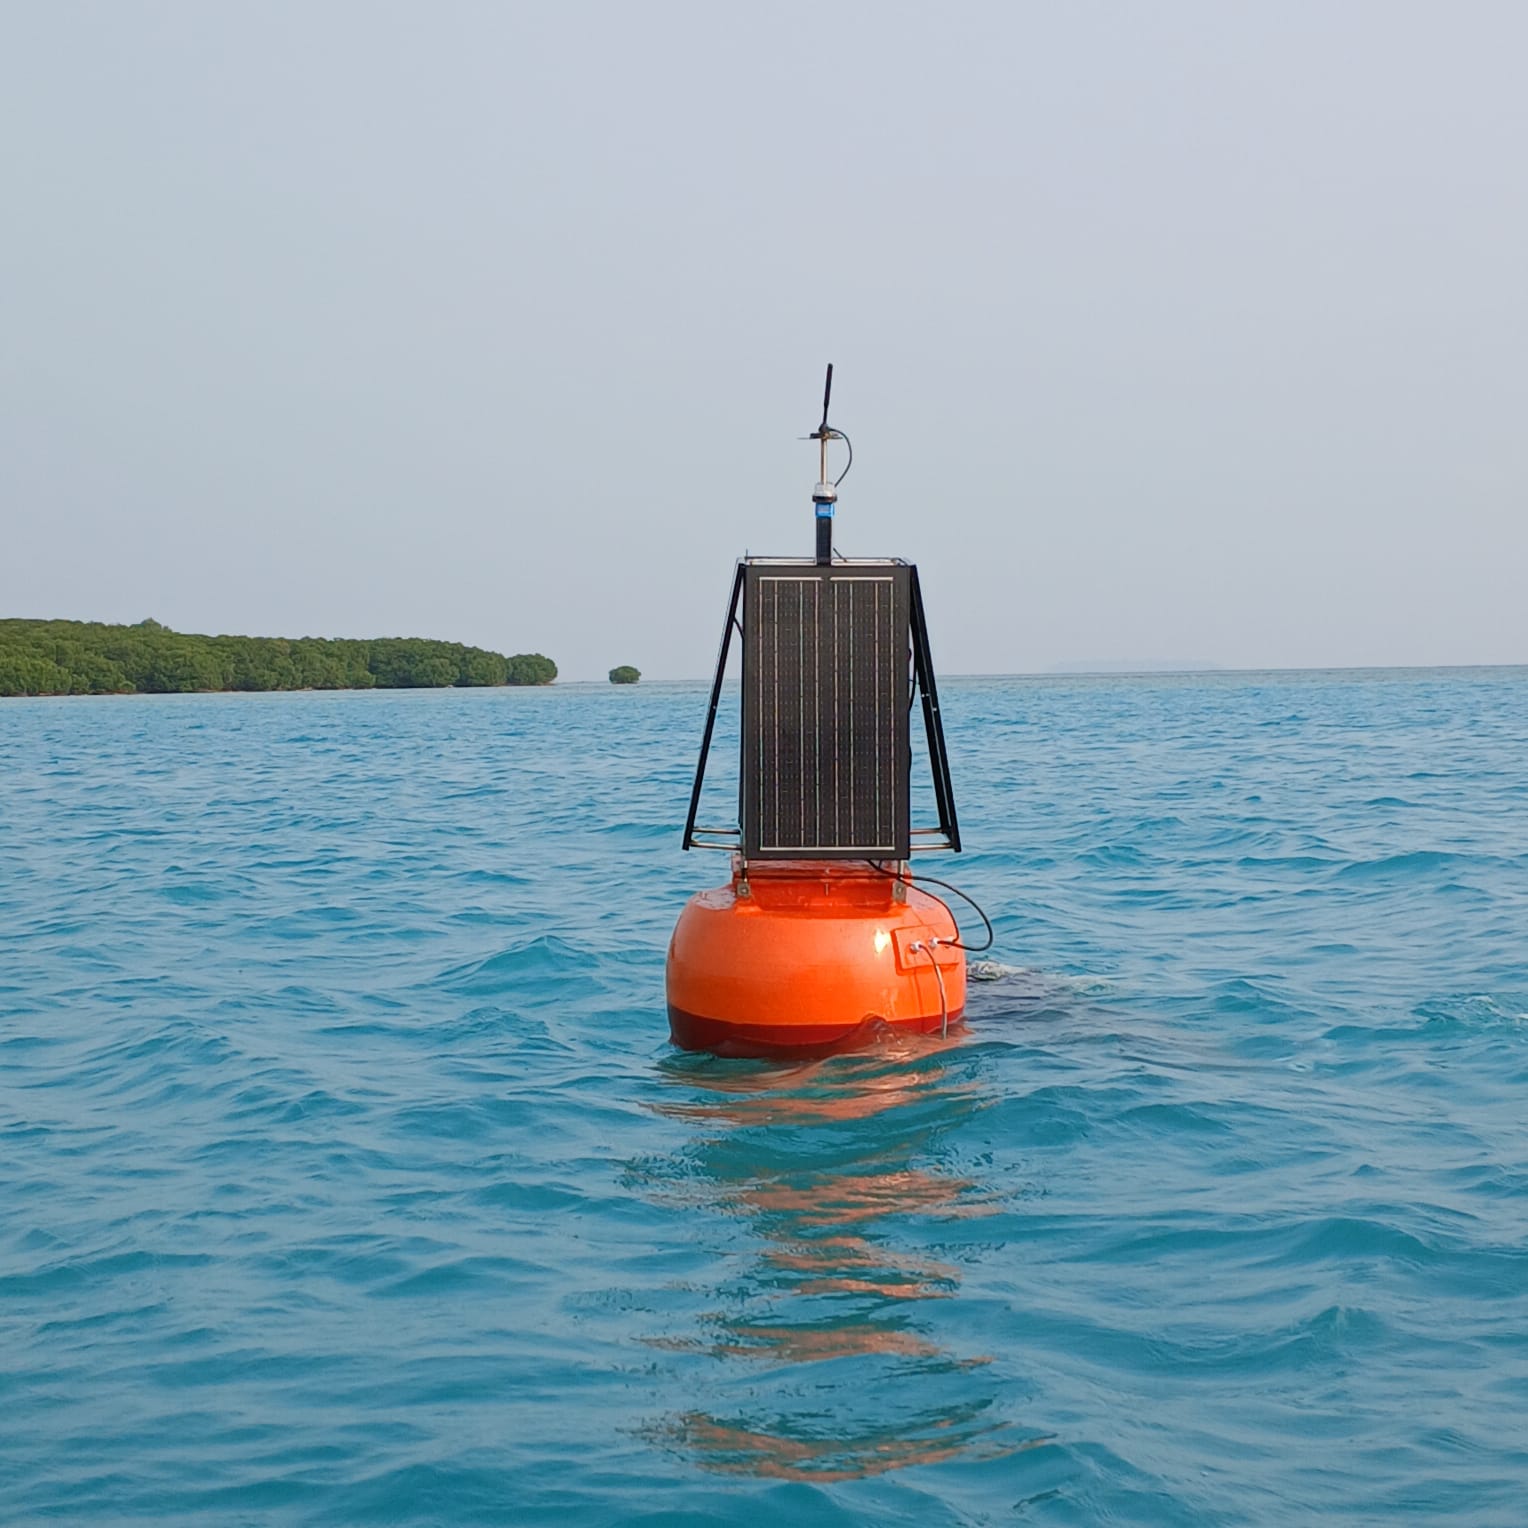
Foto dan video kegiatan tim di Pulau Pari. Klik untuk melihat lebih besar.
Non-Invasive Intelligence
Hydrophone arrays listen to the ocean without disturbing habitats. No netting, no chemical sampling — pure acoustic data captured at millisecond resolution.
Continuous 24/7 Coverage
Biological events like spawning aggregations, night feeding, and stress responses happen at all hours. PAM-Z captures the full diel cycle automatically.
Multi-Index Ecosystem Health
Six validated acoustic indices (ACI, ADI, BI, NDSI, Entropy, AEI) are synthesized into a single Soundscape Health Index, updated in near real-time.
Open Science for Indonesia
Data feeds directly into the UN Ocean Decade framework, contributing to global marine biodiversity baselines and supporting local conservation policy decisions.
AI-Ready Architecture
Raw recordings and derived indices are stored for machine learning analysis — enabling future automated species identification and anomaly detection.
📍 Click markers to see device details · 🛰️ © Esri, Maxar, Earthstar Geographics
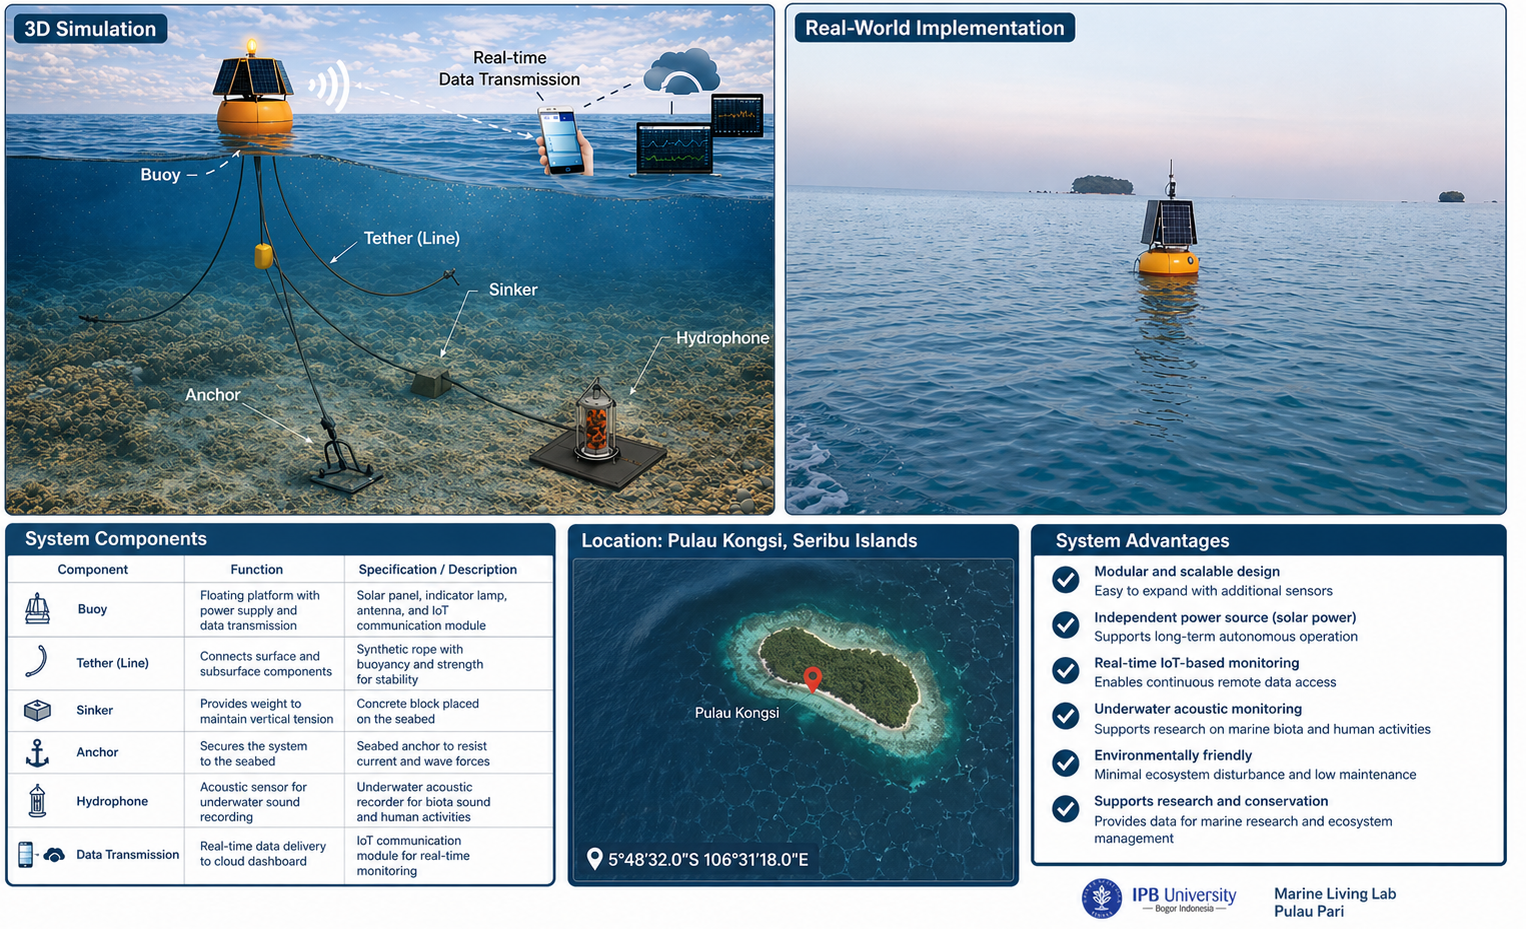
Real-time Data Transmission · Surface Buoy · Sinker · Broadband Hydrophone · Anchor System
🌬️ Wind
🌊 Tide Level
Click a device to filter all charts and data to that hydrophone unit.
The percentages above are estimated from underwater sound analysis using machine learning classification of audio segments. Waves & wind typically dominate low-frequency bands (<1 kHz), while ships produce persistent low-frequency engine noise. Snapping shrimp produce high-frequency broadband clicks (2–20 kHz) and are indicators of healthy coral reef ecosystems.
⚠️ Note: These are acoustically-derived proxies, not direct sensor measurements. For ground truth:
- 🌊 Compare wave & wind trends with our weather station.
- 📹 Cross-reference ship noise with CCTV cameras at Marine Living Lab, Pulau Kongsi.
- 🦐 Validate snapping shrimp activity with underwater camera footage synchronized with hydrophone deployment.
Each recording shows a waveform (amplitude over time) and a spectrogram (frequency content over time). The spectrogram is initially hidden and reveals itself from left to right as you play the audio, exactly following the waveform cursor.
Recordings are for signed-in users
Listening to the hydrophone recordings and their spectrograms requires an account. Researchers who would like access can request data from the PAM-Z team.
Average soundscape composition per hour of day (±1 SD error bars). Dawn and dusk hours typically show the richest bioacoustic activity in the Pulau Pari lagoon.
☀️ Day vs. Night Comparison
🌞 Day (06:00–17:59)
🌙 Night (18:00–05:59)
⏲️ 6-Hour Interval Breakdown
🌅 Dawn
00:00–05:59
☀️ Day
06:00–11:59
🌇 Dusk
12:00–17:59
🌙 Night
18:00–23:59
| 🔍 | Device | Timestamp | SHI | NDI | Masked | ACI | ADI | BI | NDSI | Entropy | AEI | 🌊% | 🏭% | 🐬% |
|---|---|---|---|---|---|---|---|---|---|---|---|---|---|---|
| rpi_f71bc593 | 2026-04-20 16:03:52 | 47.51 Poor |
-0.717 | ✓ Clear | 0.8915 | 0.3666 | 0.060457 | 0.4815 | 0.4697 | 0.9667 | 86% | 12% | 2% | |
| rpi_f71bc593 | 2026-04-20 16:02:52 | 47.36 Poor |
-0.685 | ✓ Clear | 0.8944 | 0.3638 | 0.054677 | 0.4690 | 0.4715 | 0.9626 | 85.8% | 11.9% | 2.2% | |
| rpi_f71bc593 | 2026-04-20 16:01:52 | 46.9 Poor |
-0.667 | ✓ Clear | 0.8932 | 0.3206 | 0.052381 | 0.4673 | 0.4658 | 0.9674 | 87.7% | 10.2% | 2% | |
| rpi_f71bc593 | 2026-04-20 16:00:52 | 45.22 Poor |
-0.634 | ✓ Clear | 0.8928 | 0.2093 | 0.044761 | 0.4339 | 0.4417 | 0.9779 | 92.3% | 6.3% | 1.4% | |
| rpi_f71bc593 | 2026-04-20 15:59:51 | 43.82 Poor |
-0.621 | ✓ Clear | 0.8952 | 0.1248 | 0.038579 | 0.4348 | 0.3737 | 0.9874 | 95.7% | 3.5% | 0.8% | |
| rpi_f71bc593 | 2026-04-20 15:58:51 | 44.16 Poor |
-0.661 | ✓ Clear | 0.8992 | 0.1305 | 0.043556 | 0.4484 | 0.3838 | 0.9883 | 95.6% | 3.6% | 0.7% | |
| rpi_f71bc593 | 2026-04-20 15:57:51 | 44.15 Poor |
-0.683 | ✓ Clear | 0.8976 | 0.1307 | 0.046409 | 0.4565 | 0.3716 | 0.9894 | 95.8% | 3.6% | 0.7% | |
| rpi_f71bc593 | 2026-04-20 15:56:51 | 44.62 Poor |
-0.703 | ✓ Clear | 0.8975 | 0.1569 | 0.049389 | 0.4575 | 0.3948 | 0.9876 | 94.9% | 4.4% | 0.8% | |
| rpi_f71bc593 | 2026-04-20 15:55:51 | 47.78 Poor |
-0.722 | ✓ Clear | 0.8897 | 0.3787 | 0.059318 | 0.4858 | 0.4795 | 0.9650 | 85.5% | 12.5% | 2% | |
| rpi_f71bc593 | 2026-04-20 15:54:51 | 47.51 Poor |
-0.725 | ✓ Clear | 0.8922 | 0.3727 | 0.060237 | 0.4716 | 0.4785 | 0.9651 | 85.6% | 12.4% | 2% | |
| rpi_f71bc593 | 2026-04-20 15:53:51 | 47.29 Poor |
-0.696 | ✓ Clear | 0.8937 | 0.3486 | 0.055018 | 0.4750 | 0.4707 | 0.9660 | 86.7% | 11.3% | 2% | |
| rpi_f71bc593 | 2026-04-20 15:52:51 | 47.21 Poor |
-0.673 | ✓ Clear | 0.8926 | 0.3277 | 0.052273 | 0.4828 | 0.4671 | 0.9666 | 87.6% | 10.4% | 2% | |
| rpi_f71bc593 | 2026-04-20 15:51:50 | 46.82 Poor |
-0.64 | ✓ Clear | 0.8933 | 0.2985 | 0.049252 | 0.4796 | 0.4564 | 0.9678 | 88.8% | 9.2% | 2% | |
| rpi_f71bc593 | 2026-04-20 15:50:50 | 44.43 Poor |
-0.611 | ✓ Clear | 0.8931 | 0.1392 | 0.040128 | 0.4555 | 0.3910 | 0.9856 | 95.3% | 3.8% | 0.9% | |
| rpi_f71bc593 | 2026-04-20 15:49:50 | 44.34 Poor |
-0.626 | ✓ Clear | 0.8981 | 0.1199 | 0.039374 | 0.4669 | 0.3816 | 0.9879 | 96% | 3.2% | 0.7% | |
| rpi_f71bc593 | 2026-04-20 15:48:50 | 43.5 Poor |
-0.694 | ✓ Clear | 0.8933 | 0.1002 | 0.047198 | 0.4453 | 0.3483 | 0.9915 | 96.9% | 2.7% | 0.5% | |
| rpi_f71bc593 | 2026-04-20 15:47:50 | 42.07 Poor |
-0.674 | ✓ Clear | 0.8996 | 0.0695 | 0.037257 | 0.3725 | 0.3396 | 0.9933 | 97.6% | 2% | 0.4% | |
| rpi_f71bc593 | 2026-04-20 15:46:50 | 46.11 Poor |
-0.71 | ✓ Clear | 0.8906 | 0.2512 | 0.055125 | 0.4646 | 0.4526 | 0.9771 | 91.1% | 7.6% | 1.3% | |
| rpi_f71bc593 | 2026-04-20 15:45:50 | 46.08 Poor |
-0.681 | ✓ Clear | 0.8916 | 0.2666 | 0.050860 | 0.4440 | 0.4639 | 0.9724 | 90.1% | 8.4% | 1.6% | |
| rpi_f71bc593 | 2026-04-20 15:44:50 | 47.11 Poor |
-0.733 | ✓ Clear | 0.8925 | 0.3423 | 0.061203 | 0.4747 | 0.4600 | 0.9680 | 87.2% | 11.1% | 1.7% |